13 Metrics To Improve Your Recruitment Funnel
Imagine if you could hire the perfect candidate every single time you had an open position to fill.
That would be great, wouldn’t it?
In the past, we’ve written a lot about how to help you accomplish your hiring goals, such as using I-O psychology to select the right candidates.
But one thing that hasn’t been covered yet is recruitment funnel metrics.
Just like how you track all your marketing metrics, you need to do the same with recruiting.
Or else you’ll never know how well you’re doing.
And you won’t identify ways to improve things.
So today, I’d like to talk to you about:
- 13 useful metrics to track so that you can make sure your recruitment funnel reels in high-quality talent — and doesn’t let them sneak out.
- How to calculate each metric (don’t worry, it’s first-grade level math).
- What the research says about using these metrics in recruiting efforts
In a rush? Want to download this article as a PDF so you can easily take action on it later? Click here to download this article as a PDF guide.
Recruitment Funnel Metric #1: Cost per Hire
Now this metric is easy to track in your recruitment funnel.
All you need to do is divide your total recruiting costs by the number of hires you placed for the year.
Remember, there are internal costs and external costs to factor in.
Internal costs include things like:
- Recruiter salaries
- Costs for interviewing (hourly rates x number hours spent interviewing)
- Money you spend on employee referrals
And external costs can include the following:
- Technology costs
- Advertising costs on job boards/newspapers
- Headhunter agency fees
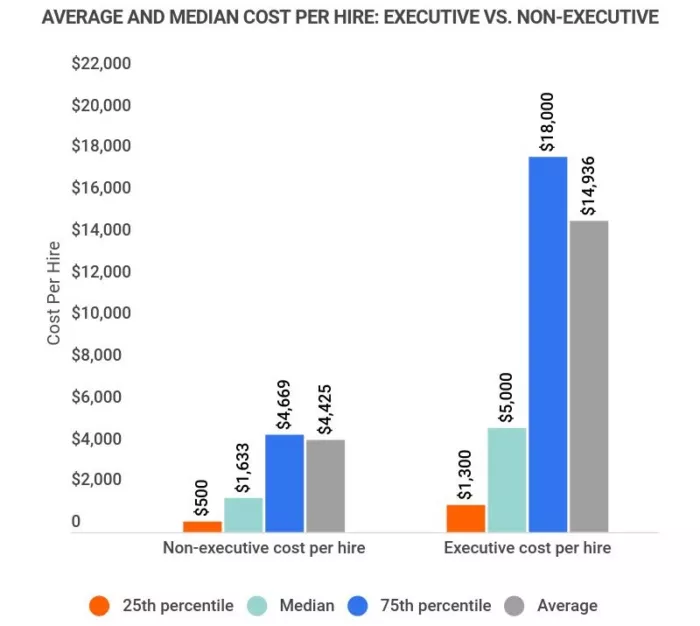
The top three things that affect cost per hire are industry, company size, and the expertise level required. For non-executive positions, the average cost per hire is between $3,000 and $5,000, according to Zipia.
Recruitment Funnel Metric #2: Time To Hire
Time is money, as they say.
If your hiring process is too slow, quality candidates will get accepted elsewhere.
So by tracking your time to hire, your team has a sense of how efficiently operations are running.
Finding your time to hire is simple. Just look at how many days passed between a candidate applying to your job and when the job offer was accepted.
According to a Robert Half survey, the thing that frustrates candidates the most is a lengthy post-interview follow-up — with 57% of people citing this pain point.
And Glassdoor’s research tells us that the typical time to hire is anywhere between 10 and 60 days.
Yes, I know that’s not a great indicator.
But here’s the thing…while retail jobs and restaurant jobs don’t require much time to place a hire, other sectors, such as government jobs, require a lot more candidate scrutiny.
Time to hire also depends on the country where the organization is located.
For example, the average time to hire in the United States is 23.8 days, while in Brazil, it’s 39.6 days. As it seems, culture plays a role in how long the process takes.
And by the way, just like with cost per hire, time to hire is affected by the seniority level of the position being filled.
According to recent research from Yello, 41% of recruiters say they can fill mid-level positions within three weeks. But for executive positions, that number is just25%.
Recruitment Funnel Metric #3: Time To Fill
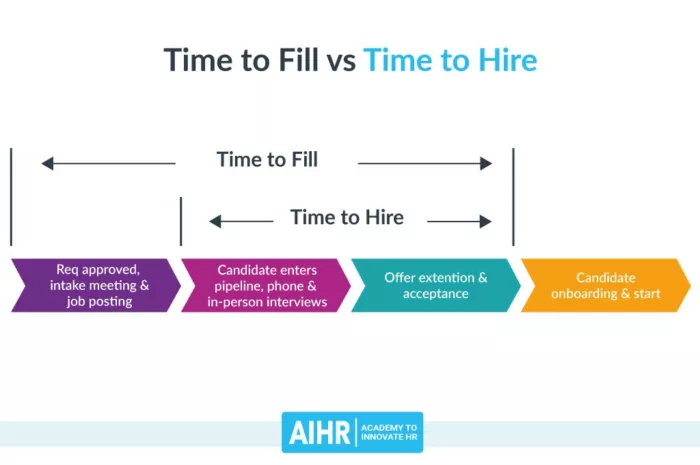
Time to fill is a recruitment funnel metric that often gets confused with time to hire.
Whereas time to hire measures how long it takes for a candidate to apply and accept a job offer, time to fill measures how long it takes to fill your open position, starting with the day you post it.
So say you post your job listing on LinkedIn on March 11 and your candidate accepts your job offer on April 12. That means your time to fill was 33 days.
Knowing how long you can expect it to take to fill a certain role helps with business planning, such as forecasting worker capacity.
And you can also see what kind of bottlenecks might be hurting your recruitment process.
For example, if there’s a lot of time between when you post your listing and when you get a large applicant pool, then you might need to use other job boards.
Recruitment Funnel Metric #4: Candidate Experience
If you don’t keep tabs on how job seekers view your recruitment process, you might lose out.
As found by CareerBuilder, 68% of candidates think the candidate experience is a reflection of how they will be treated if they work for your company.
Candidate experience refers to how candidates perceive your recruitment process.
This gives you a great opportunity to see where your strong points are and where you might be losing good candidates.
We recommend treating your candidate experience metric the same way you would with determining customer satisfaction.
If you want, you can use quick polls and surveys to gather feedback.
Ask them a few questions like:
- How would you rate the process?
- Which aspect of the process did you like the most?
- Which aspect of the process did you dislike the most?
- How satisfied were you with the length of the process?
Most of these questions can be scored on a numerical scale. From there, you can calculate the average score for each question to determine the overall impression candidates have.
If you ask for qualitative data, like the third question above, use a multiple-choice format and see what the most popular responses are.
Recruitment Funnel Metric #5: Application Completion Rate
Have you ever wondered if your application process is satisfactory for candidates?
Well, your application completion rate will give you a good idea.
To calculate this recruitment funnel metric, simply divide the number of people who completed your application form by the number of people who started it — then multiply that number by 100.
As long as you’re using an applicant tracking system, you should be able to track this information.
It just might be that you’re asking too many questions or insensitive ones.
Recruiter.com says that completion rates plummet 365% when the application takes longer than 15 minutes.
Try to keep the application process as easy as possible to attract a wider range of talent.
Recruitment Funnel Metric #6: Candidate Callback Rate
Recruiting has a lot in common with sales.
With both occupations, you’re trying to sell your brand to people who you think will bring your organization value.
And both are a numbers game.
When you’re recruiting, you’ll need to solicit a lot of people by messages and phone calls.
Actually, as noted by Recruiter.com, the average recruiter spends 25 hours per week on the phone.
And get this…survey results from SocialTalent show that recruiters only get a response from 28% of candidates on LinkedIn. And of those candidates that do respond, only 27% say they want to move to the next step.
If you want to determine your candidate callback rate, divide the number of people who had a call with you by the number of people you reached out to — and multiply by 100.
This recruitment funnel metric shines a light on how effective your outreach messages are.
Maybe your messages need to be more personalized. Or perhaps you need to try new channels to find talent (social media, email, etc.).
Recruitment Funnel Metric #7: Turnover Rate
There’s no better way to gauge your ability to land the right candidates than by looking at your turnover rate.
Because if you find that 25% of your new hires quit within a few months, that’s a bad sign. Maybe you’re rushing things. Or perhaps you’re not doing a good job explaining the role accurately.
And plus, it’s just expensive.
Studies from The Society for Human Resources Management show that replacing an employee costs, on average, 6 to 9 months of their salary.
In order to calculate turnover, divide the number of employees who parted ways with your organization within a given time period by the number of employees you had at the beginning of the period — and multiply by 100.
Recruitment Funnel Metric #8: Quality of Hire
Quality of hire tells you how profitable the candidate is to your organization.
The thing is, there are numerous ways to calculate the quality of hire since it depends on what criteria you prioritize.
For a salesperson, maybe it’s how many deals they’re closing or performance reviews. For a developer, maybe it’s how many apps they scan per month trying to identify errors.
Moreover, managers might be asked to score an employee after a year.
Companies can come at this recruitment funnel metric in all kinds of ways.
But one thing is for sure…business leaders understand how important it is to track quality of hire. Research from LinkedIn indicates that 88% of organizations see it as a very useful metric to track.
Unfortunately, it’s quite challenging to calculate.
Usually, companies look at a combination of factors, such as performance (e.g. sales quota), manager satisfaction, retention, and similar things.
Recruitment Funnel Metric #9: Source of Hire
Do you get more candidates from a specific job board? Or from your website?
Or maybe your employee referral program yields the best results.
Source of hire tells you which channels to focus more on and which ones to drop.
Say that you hired 20 people last year.
And the sources of hire are broken down into the following:
- 1 from LinkedIn
- 8 from your website
- 2 from a career fair
- 9 from referrals
To calculate source of hire into a percentage for this example, divide how many hires came from a channel by 20 (total hires), then multiply that by 100.
For example, 45% of your hires came from referral in this scenario since 9/20 x 100 = 45.
Keeping in line with the above scenario, it tells you to double down on employee referrals and your careers page. Meanwhile, LinkedIn and career fairs could either be dropped or improved upon.
Recruitment Funnel Metric #10: Yield Ratio
Yield ratios tell you the percentage of candidates that move on to the next stage in your recruitment funnel.
For example, of 30 candidates you call for an initial screening, 15 get a second interview.
This would be a 50% yield ratio.
As you move on deeper in the recruitment process, the yield ratio naturally decreases since you’re eliminating some candidates each time you move to the next stage.
Yield ratios are kind of a fine art. You want it to be low but not so low that you’re turning down great candidates.
As you monitor this recruitment funnel metric over time, you’ll get a sense for which stages of your process need to be tightened up. That way, you make better use of your resources.
Recruitment Funnel Metric #11: Applicants per Opening
When your job description is vague and lacking in great detail, you’ll receive a lot of applications.
If you find that the quality of applicants is good, then that’s a sign that your job posts are effective at attracting the right candidates.
However, if you see a low quality of candidates, then your job posts aren’t targeting the right people.
If you don’t add enough details, a lot of job seekers will think they’re a good fit since your description is broad.
When that happens, you’ll have more work cut out for you.
In that case, you might want to add more requirements.
On the contrary, if your job description is too strict and highly specific, you risk not receiving enough applications.
As we pointed out in our article on recruitment stats, shorter job descriptions (300 words or less) receive 8.4% more applications. That’s because nobody wants to read a novel when they apply for a job.
Tracking applicants per opening will help you understand what works when it comes to attracting the attention of qualified job seekers.
Recruitment Funnel Metric #12: Offer Acceptance Rate
Offer acceptance rate is an embodiment of how well your team is at attracting the right talent, nurturing them through your recruitment funnel, and providing them with the right employee package.
If you find that your acceptance rate is low, then maybe you should discuss compensation and benefits earlier in the screening process.
Or maybe you simply take too long and your candidates accept offers somewhere else first.
Of course, you aim for your offer acceptance rate to be 100%.
But that’s just not going to happen.
As a good reference, Glassdoor’s research suggests that the average acceptance rate among professional and technical jobs is 78.4%.
And it appears that tougher interviews get higher rates of acceptance.
Recruitment Funnel Metric #13: Time to Productivity
Once you hire someone, you want them to become fully competent as soon as possible, right?
Well, calculating the average time to productivity will tell you how long it takes your average employee to reach that point.
But it’s not so straightforward to measure.
You see, different job titles have different performance indicators you need to track.
And you wouldn’t expect a fresh college graduate to get up to speed as quickly as a CFO, right?
For this, it’s up to you to decide what’s considered a productive level of performance.
As an example, maybe you have a certain milestone you want your new employees to hit.
And to calculate the time to productivity, you’d just add up how many total days it took for all your employees individually to reach that milestone and divide that by the number of employees you’re evaluating.
On average, it takes 8 months for a new employee to become fully productive, as reported in a press release from Allied HR IQ.
Remember, there should be a clear distinction between new hires from each department or role. Don’t include all your new employees into the same calculation.
Obviously, a lower time to productivity is better. And if you’re not satisfied with your average time to productivity, there are a few different interpretations:
- Your standard is too high or unreasonable
- You’re hiring the wrong candidates
- Your onboarding program needs improvement
Conclusion
Download the “Top 13 Metrics To Revamp Your Recruitment Funnel” so you won’t forget to take action on it later. Click here to download it now.
Recruitment, like any other business function, requires you to always be looking for ways to measure success.
And tracking metrics is the only way to do that.
Although there’s a myriad of options when it comes to choosing the metrics to track, the 13 metrics pointed out in this reading are a good starting point.
Just make sure to benchmark your metrics against the known industry averages (some of which were shared in the reading).
Over time, you’ll refine your recruitment process to a state where you attract, acquire, and retain the best talent available.
But wouldn’t it be better if you could acquire quality talent without worrying about the hiring process?
If you’d rather forget about refining your process or you think it’ll take you a while to do so, consider delegating all your marketing projects to Growbo. Try Our $7-for-7-Days Trial Today.
Now, tell me something…
Which recruitment metrics are you going to start using?
Let me know in the comments below.
Keep Growin’, stay focused.


